목차
1. 사전 준비
2. EKS로 클러스터 구성하기
3. Kubectl을 이용해 노드 구성하기
3-1. 노드 마이그레이션
4. helm 설치
5. Auto Scaling Application and Cluster
5-1. HPA
5-2. CA
6. Prometheus
7. Grafana
1. 사전 준비
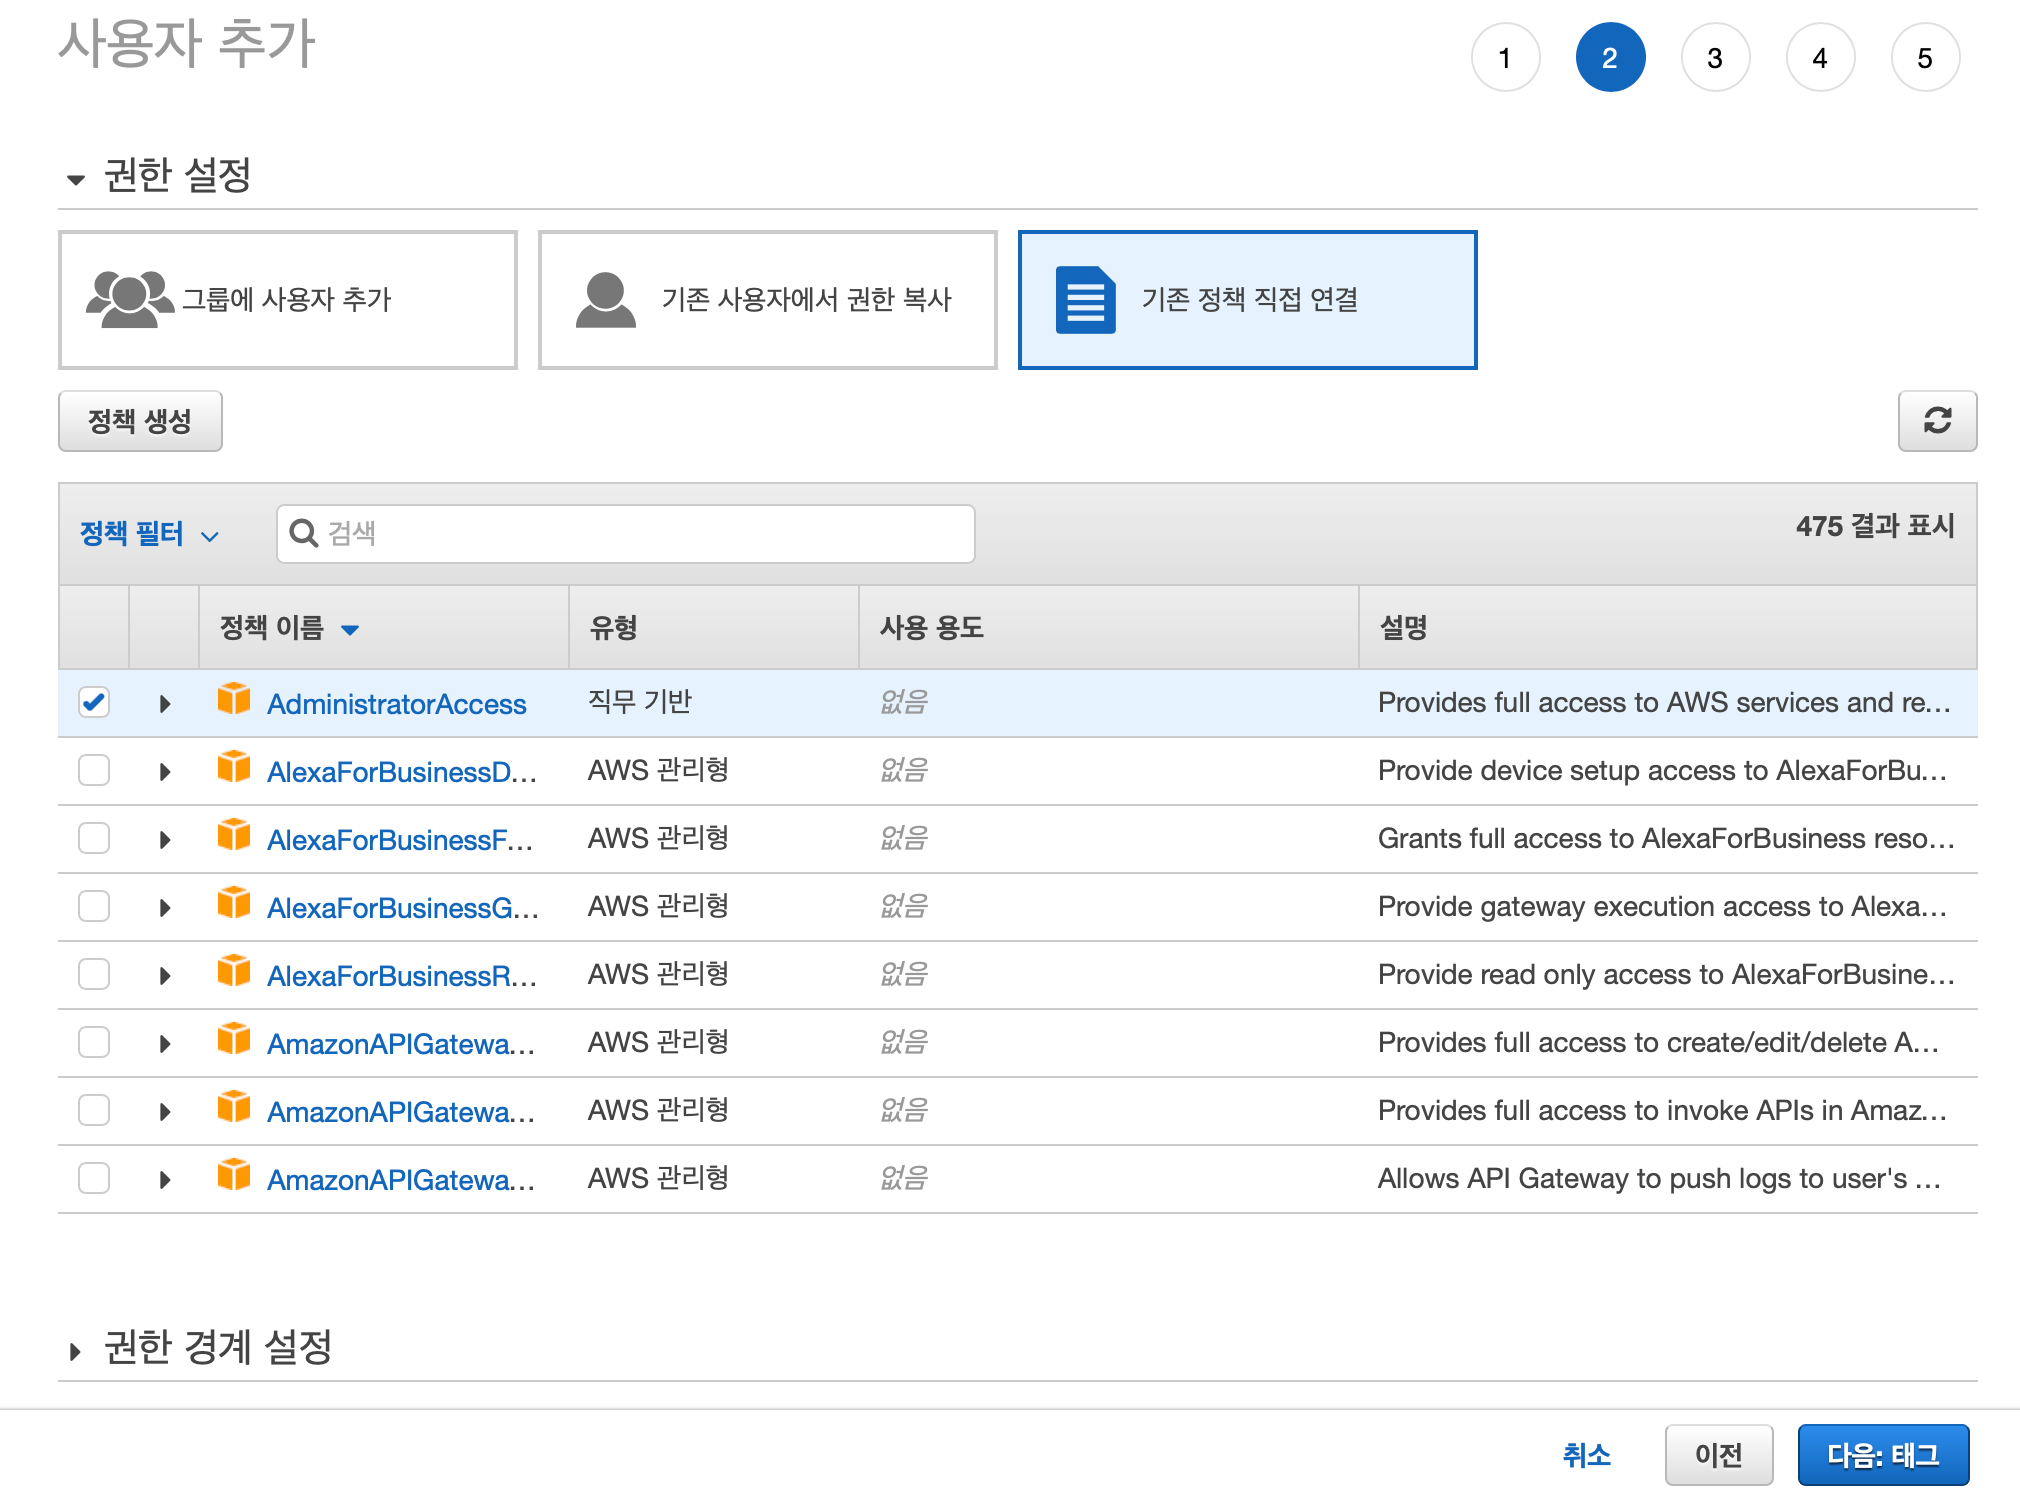
AWS 가입 후, EKS Hands on Lab을 따라할 IAM계정을 생성하겠습니다.
이 testeks라는 이름을 가진 IAM계정에는 administrator access권한을 주었습니다.
(아직 학습이 부족하여 구체적으로 eks를 사용하는데 얼마나 많은 요소가 들어가는지 파악중입니다. 파악되면, 해당 요소만 컨트롤 하는 권한만 정리하여 수록하겠습니다.)

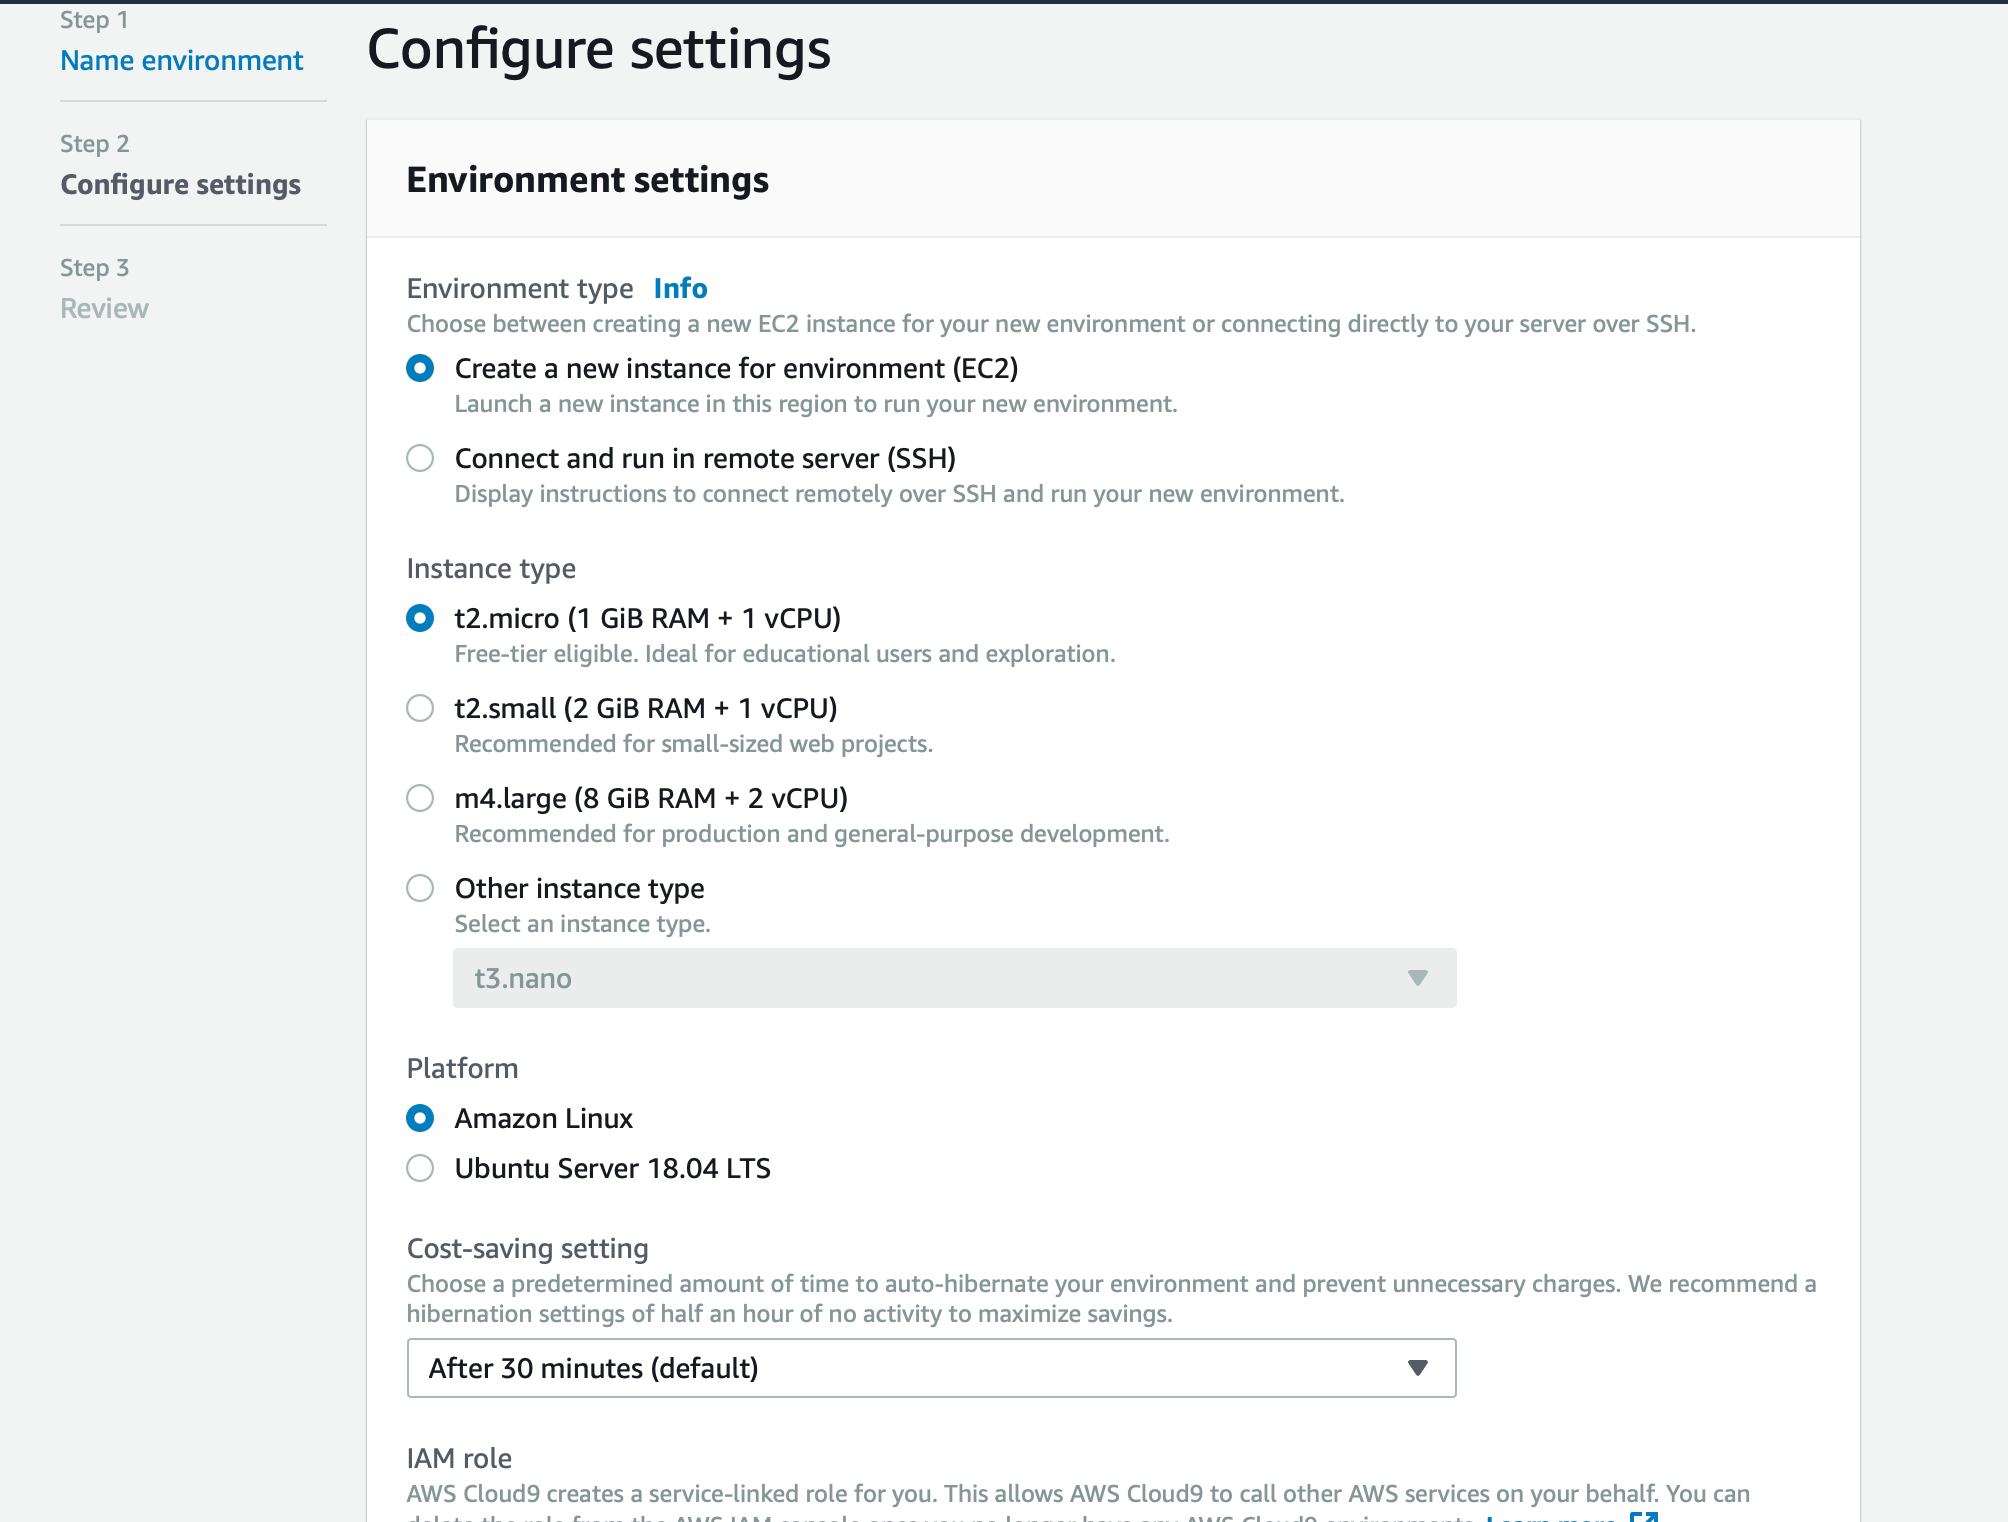
생성한 IAM계정을 통하여 c9를 workspace를 생성하겠습니다.
일반 인스턴스 터미널로 해도 상관 없지만 코드를 읽으면서 가독성 있는 실습을 위해 c9를 선택하였습니다.
설정은 다음과 같이 진행하였습니다.
설치 후, 다음과 같이 kubectl 와 jq(Json command-line processor), gettext(쉘 환경변수를 대체하는 envsubst)를 설치합니다.
설치 후, kubectl을 사용해야 하므로, kubectl에 실행 권한을 chmod에 추가합니다
sudo curl --silent --location -o /usr/local/bin/kubectl https://storage.googleapis.com/kubernetes-release/release/v1.13.7/bin/linux/amd64/kubectl
sudo chmod +x /usr/local/bin/kubectl
sudo yum install -y jq gettext

cloud9에서 eks를 구성하므로, cloud9으로 인해 생성된 instance에 그에 상응하는 권한을 할당해야 합니다.
다음과 같이 admin권한을 가진 ekstest-admin role을 생성하여 cloud 9 인스턴스에 역할을 부여합니다.
또한, eks에서도 ec2에 대한 자원을 자동으로 management하기 때문에 이에 상응하는 역할도 부여해야합니다.


역할을 부여한 후, c9 내부에서 다음과 같은 설정을 해주어야 합니다.
c9는 생성자의 권한을 따라가기 때문에, 이 권한을 해제하고 직접 권한을 세팅해주기 위해 다음과 같은 설정이 필요하다.

다음 명령어를 통해 cloud 9에 있는 credential에 대한 정보를 삭제한 다음,
rm -vf ${HOME}/.aws/credentials
account id 와 region 정보는 계속해서 사용할 것이므로, 해당 workspace에 global 설정을 하겠습니다.
export ACCOUNT_ID=$(aws sts get-caller-identity --output text --query Account)
export AWS_REGION=$(curl -s 169.254.169.254/latest/dynamic/instance-identity/document | jq -r '.region')
echo "export ACCOUNT_ID=${ACCOUNT_ID}" >> ~/.bash_profile
echo "export AWS_REGION=${AWS_REGION}" >> ~/.bash_profile
aws configure set default.region ${AWS_REGION}
aws configure get default.region
role이 제대로 적용되고, c9설정 변경이 제대로 되었다면, aws 명렁어를 통해 현재 할당된 role를 확인한다.
다음과 같이 ARN 항목에 우리가 작성한 role name이 뜨면 성공적으로 작업이 완료 된 것이다.
aws sts get-caller-identity

2. EKS로 클러스터 구성하기
다음 명령어를 이용하여, eks를 구성할 eksctl를 설치하고, 리눅스 시스템의 사용자 명령어로 쓰일 수 있도록 /usr/local/bin 폴더로 패키지를 옮긴다.
curl --silent --location "https://github.com/weaveworks/eksctl/releases/download/latest_release/eksctl_$(uname -s)_amd64.tar.gz" | tar xz -C /tmp
sudo mv -v /tmp/eksctl /usr/local/bin
설치 후 , eksctl를 터미널에 입력하여 다음과 같은 메시지가 나오면 정상이다.
The official CLI for Amazon EKS
Usage: eksctl [command] [flags]
Commands:
eksctl create Create resource(s)
eksctl get Get resource(s)
eksctl update Update resource(s)
eksctl delete Delete resource(s)
eksctl scale Scale resources(s)
eksctl drain Drain resource(s)
eksctl utils Various utils
eksctl completion Generates shell completion scripts
eksctl version Output the version of eksctl
eksctl help Help about any command
Common flags:
-C, --color string toggle colorized logs (valid options: true, false, fabulous) (default "true")
-h, --help help for this command
-v, --verbose int set log level, use 0 to silence, 4 for debugging and 5 for debugging with AWS debug logging (default 3)
Use 'eksctl [command] --help' for more information about a command.
이제 클러스터를 구성할 것이다. 다음 명령어를 입력하여 node가 3개고, alb ingress filter(alb를 쿠버네티스 상에서 프로비저닝하는 역할)가 적용된 application load balancer가 포함된 vpc로 구성된 eksworkshop 클러스터를 구성한다.
+20191010 추가내용
클러스터 생성시, 입력하는 노드 갯수와 같은 수의 인스턴스가 생성되며, 서브넷은 가용영역 당 하나씩 생성된다. 싱가포르 리전의 경우, 가용영역이 a,b,c이므로, 이에 상응하는 서브넷이 생성된다. 인스턴스 생성 순서는 가용영역 알파벳 순서이다.
eksctl에는 많은 파라미터 들이 있으니 eksctl 사용법을 참고바란다.

eksctl create cluster --name=eksworkshop-eksctl --nodes=3 --alb-ingress-access --region=${AWS_REGION}
다음과 같이 로그가 보이면 성공적으로 구성이 된 것이다.
[ℹ] using region ap-southeast-1
[ℹ] setting availability zones to [ap-southeast-1a ap-southeast-1b ap-southeast-1c]
[ℹ] subnets for ap-southeast-1a - public:192.168.0.0/19 private:192.168.96.0/19
[ℹ] subnets for ap-southeast-1b - public:192.168.32.0/19 private:192.168.128.0/19
[ℹ] subnets for ap-southeast-1c - public:192.168.64.0/19 private:192.168.160.0/19
[ℹ] nodegroup "ng-abc5205f" will use "ami-06206d907abb34bbc" [AmazonLinux2/1.13]
[ℹ] using Kubernetes version 1.13
[ℹ] creating EKS cluster "eksworkshop-eksctl" in "ap-southeast-1" region
[ℹ] will create 2 separate CloudFormation stacks for cluster itself and the initial nodegroup
[ℹ] if you encounter any issues, check CloudFormation console or try 'eksctl utils describe-stacks --region=ap-southeast-1 --name=eksworkshop-eksctl'
[ℹ] CloudWatch logging will not be enabled for cluster "eksworkshop-eksctl" in "ap-southeast-1"
[ℹ] you can enable it with 'eksctl utils update-cluster-logging --region=ap-southeast-1 --name=eksworkshop-eksctl'
[ℹ] 2 sequential tasks: { create cluster control plane "eksworkshop-eksctl", create nodegroup "ng-abc5205f" }
[ℹ] building cluster stack "eksctl-eksworkshop-eksctl-cluster"
[ℹ] deploying stack "eksctl-eksworkshop-eksctl-cluster"
[ℹ] building nodegroup stack "eksctl-eksworkshop-eksctl-nodegroup-ng-abc5205f"
[ℹ] --nodes-min=3 was set automatically for nodegroup ng-abc5205f
[ℹ] --nodes-max=3 was set automatically for nodegroup ng-abc5205f
[ℹ] deploying stack "eksctl-eksworkshop-eksctl-nodegroup-ng-abc5205f"
[✔] all EKS cluster resource for "eksworkshop-eksctl" had been created
[✔] saved kubeconfig as "/home/ec2-user/.kube/config"
[ℹ] adding role "arn:aws:iam::511105578551:role/eksctl-eksworkshop-eksctl-nodegro-NodeInstanceRole-ECWQU3TC1J17" to auth ConfigMap
[ℹ] nodegroup "ng-abc5205f" has 0 node(s)
[ℹ] waiting for at least 3 node(s) to become ready in "ng-abc5205f"
[ℹ] nodegroup "ng-abc5205f" has 3 node(s)
[ℹ] node "ip-192-168-0-173.ap-southeast-1.compute.internal" is ready
[ℹ] node "ip-192-168-49-93.ap-southeast-1.compute.internal" is ready
[ℹ] node "ip-192-168-72-198.ap-southeast-1.compute.internal" is ready
[ℹ] kubectl command should work with "/home/ec2-user/.kube/config", try 'kubectl get nodes'
[✔] EKS cluster "eksworkshop-eksctl" in "ap-southeast-1" region is ready
+20191009 추가내용
workshop때는 admin권한을 주고 cluster를 구성하였으나, admin권한은 보안적으로 취약하므로, 위 로그를 참고하여 생성되는 리소스에 대한 권한은 모두 포함되는 role를 생성하여 할당 하는 것이 바람직합니다.
sg, cluster, internet gateway, elastic ip, subnet route table, iam policy, subnet, vpc, vpc gateway
위와 같이 성공 하였다면, 지금 우리는 다음과 같은 구성으로 Architecture를 구축한 것입니다.

3. Kubectl을 이용해 노드 구성하기
이제 각 노드에 대해 디플로이먼트와 서비스를 배포해보겠다. (현재는 퍼블릭 서브넷에다 배포를 하지만, 추후 private subnet으로 노드를 구성하여 배포를 하는 방법도 위키에 올리겠습니다.)
앱을 배포하기 위해서는 이전에 설치한 kubectl을 사용해야 하며 사용법은 링크를 참고한다.
배포하기 앞서 다음의 깃허브 레포지토리에서 샘플 앱을 다운받는다.
cd ~/environment git clone https://github.com/brentley/ecsdemo-frontend.git
git clone https://github.com/brentley/ecsdemo-nodejs.git
git clone https://github.com/brentley/ecsdemo-crystal.git
다운로드 후, 다음과 같이 kubernetes cluster안에 service와 deployment를 생성해보자.
kubectl apply -f [your project directory path]/kubernetes/deployments.yaml
kubectl apply -f [your project directory path]/kubernetes/service.yaml
kubectl get pods
kubectl get service
kubectl get deployment
이 작업을 통해 백앤드 샘플에 대해 pod을 생성하고 이를 deployment로 묶어 service를 통해 아이피를 할당 받아 app 서비스를 할 준비를 마쳤다. pod과 deployment와 service간의 관계를 잘 모른다면, 이전 페이지를 참고한다.
이와 같은 방식으로 crystal 백앤드와 프론트앤드의 deployment와 service를 생성한다. 모두 생성하고
kubectl get all 을 실행하면 다음과 같은 리소스들이 출력된다.
Load Balancer생성 전 생성 권한이 없으면 에러가 난다. 에러 출력시, 다음 코드로 권한을 부여한다.
aws iam create-service-linked-role --aws-service-name "elasticloadbalancing.amazonaws.com"

deployment, service가 정상적으로 이루어졌다면, 다음과 같은 화면이 계속 새로고침 될 것이다.

이제 deployment의 replica를 늘려보도록 하자. 명령어를 다음과 같이 입력한다.
kubectl scale deployment ecs-demo-nodejs --replicas=3
kubectl scale deployment ecs-crystal --replicas=3
kubectl scale deployment ecs-frontend --replicas=3
입력 후 kubectl get deployment의 상태가 다음과 같이 바뀐다.

3-1. 노드 마이그레이션
그러나 크레딧을 아끼기 위해 노드의 인스턴스 타입을 t2.nano로 한 탓에 cpu가 감당이 안되어 deployment scaling이 제대로 일어나지 않았다. 이 참에 nodegroup 마이그레이션을 배우지 않았지만, 스스로 문서에서 찾아서 해보기로 하였다.
가장 먼저 노드 그룹을 하나 더 만들었다. 다음 코드를 입력하면 캡쳐한 화면과 같이 결과가 출력된다.
eksctl create nodegroup
--cluster eksworkshop-eksctl
--name migratedgroup
--node-type t3.medium
--nodes 3
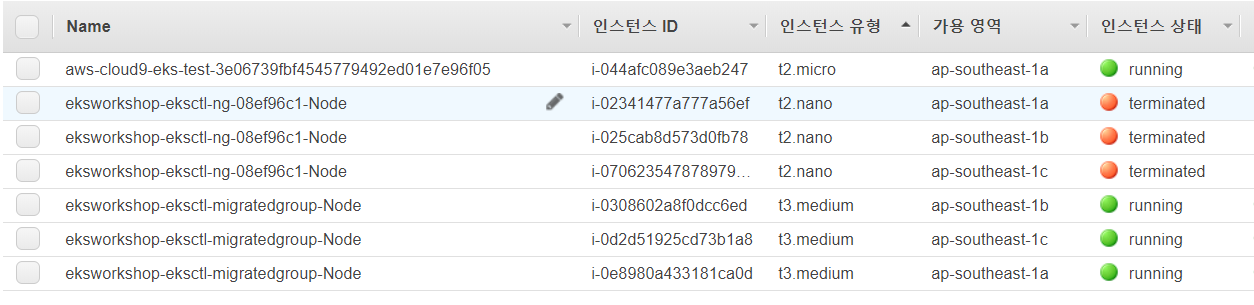
이 화면이 뜨면, 다음과 같이 인스턴스가 만들어져 있을 것이다. (저는 t3.medium으로 하였습니다.)

이제 노드를 마이그레이션 해보겠습니다. 기존 사용하던 node를 삭제하면 자동으로 다른 nodegroup에 마이그레이션 된다고 한다.
eksctl delete nodegroup --cluster eksworksup-eksctl --name [nodegroup name]


위 명령어를 입력하면 기존 사용하던 노드가 삭제되고, kubectl get pods를 입력해보면 다음과 같이 새로 컨테이너들이 만들어지고 있는 것을 확인 할 수 있다.
테스트 하면서 공부할 땐, 과금을 무서워 하지말고 팍팍쓰는게 나을거 같다는 생각이 들었다.
이제 진짜로 scaling을 해보겠다. 다음 명령어를 입력해서 replica를 3개 까지 늘려보도록 하자.
kubectl scale deployment ecsdemo-nodejs --replicas=3
kubectl scale deployment ecsdemo-frontend --replicas=3
kubectl scale deployment ecsdemo-crystal --replicas=3

위와 같은 터미널 화면을 마주한다면, 정상적으로 scaling이 된 것이다.
이제 로드밸런서 타입의 서비스를 통해 우리가 배포한 앱을 확인 할 것이다.
deployment를 복제하여 앱을 배포한 결과, 다음과 같이 고가용성을 만족한 배포가 이루어 졌음을 눈으로 볼 수 있다.
4. helm 설치
이 부분에 대해서는 설치만 진행하였습니다. 자세한 내용은 개인적으로 더 스터디 하여 공유하겠습니다.
Helm은 여러 Kubernetes 리소스를 Chart라는 단일 논리적 배포 단위(쿠버네티스를 관리하면서 나오는 yaml로 구성된 파일의 집합)로 패키지화하는 Kubernetes 용 패키지 관리자 및 응용 프로그램 관리 도구이다. Helm은 tiller라는 서버를 통하여 Kubernetes api server과 통신을 하여 Kubernetes를 관리할 수 있다. 이후 챕터에 필요하므로, 건너뛰지 말고 꼭 설치하도록 하자.
Helm의 기능을 정리하면 다음과 같다.
-
단일 또는 반복이 가능한 배포
-
3rd party서비스를 사용하여 응용 프로그램의 종속성 관리
-
환경에 알맞는 배포의 구성 관리 (ex. test, stagging, production)
-
사후 / 사전 배포 작업 실행
-
응용 프로그램 배포 업데이트 / 롤백 / 테스트
-
Helm을 설치하는 script를 curl로 받아와서 해당 파일을 실행해야하므로, 실행권한까지 부여한다.
cd ~/environment
https://raw.githubusercontent.com/kubernetes/helm/master/scripts/get > get_helm.sh
chmod +x get_helm.sh
sh get_helm.sh
helm 설치 쉘스크립트를 실행하면 helm init을 입력하라고 메시지가 뜬다. 이를 입력 하지 말고, 다음 안내를 따라서 tiller에 최적화된 helm을 설치한다. 만약 입력 하였을시, helm reset -force를 입력하여 helm을 초기화하고 다시 진행한다.
2. 다음 스크립트를 입력하여 tiller(helm 클라이언트의 서버)를 운영할 service account를 만들고 tiller까지 설치한다.
cat <<EoF > ~/environment/rbac.yaml
---
apiVersion: v1
kind: ServiceAccount
metadata:
  name: tiller
  namespace: kube-system
---
apiVersion: rbac.authorization.k8s.io/v1beta1
kind: ClusterRoleBinding
metadata:
  name: tiller
roleRef:
  apiGroup: rbac.authorization.k8s.io
  kind: ClusterRole
  name: cluster-admin
subjects:
  - kind: ServiceAccount
    name: tiller
    namespace: kube-system
EoF
yaml 파일을 다음과 같이 입력 후,
kubectl apply -f ~/environment/rbac.yaml
helm init --service-account tiller
까지 입력해주면 helm설치가 완료되게 된다.
정상적으로 입력이 되었을 때,
Creating /home/ec2-user/.helm
Creating /home/ec2-user/.helm/repository
Creating /home/ec2-user/.helm/repository/cache
Creating /home/ec2-user/.helm/repository/local
Creating /home/ec2-user/.helm/plugins
Creating /home/ec2-user/.helm/starters
Creating /home/ec2-user/.helm/cache/archive
Creating /home/ec2-user/.helm/repository/repositories.yaml
Adding stable repo with URL: https://kubernetes-charts.storage.googleapis.com
Adding local repo with URL: http://127.0.0.1:8879/charts
$HELM_HOME has been configured at /home/ec2-user/.helm.

Tiller (the Helm server-side component) has been installed into your Kubernetes Cluster.

Please note: by default, Tiller is deployed with an insecure 'allow unauthenticated users' policy.
To prevent this, run `helm init` with the --tiller-tls-verify flag.
For more information on securing your installation see: https://docs.helm.sh/using_helm/#securing-your-helm-installation
다음과 같이 출력되면 정상이다.
5. Autoscaling Application and Clusters
이전 튜토리얼에서는 수동으로 스케일링을 하였다. 그러나 이번 튜토리얼은 자동으로 scaling하는 방법에 대해 알아 볼 것이다.
먼저 Scaling의 유형에는 2가지 유형이 존재한다.
-
Horizontal Pod Autoscaler (HPA) 는 deployment안에 있는 pod의 replica set을 scaling한다. HPA는 Kubernetes API 리소스와 컨트롤러에 대해서 상속되어있다. 컨트롤러 관리자는 HorzontalPodAutoScaler 정의에 대해 명세된 지표에 따라 이때 resource utilization을 쿼리한다.
-
Cluster Autoscaler(CA)는 Kubernetes의 pod과 node에 대해서 모두 scaling을 할 수 있닌 기본 컴포넌트이다. CA는 자동으로 pod이 자리를 잡아 실행 될 수 있도록 Auto Scaling Group의 크기를 늘릴 수 있으며, 유휴상태일 시 자동으로 node를 줄일 수도 있다.
5-1. HPA
Metric서버는 리소스 사용량에 관한 데이터를 수집하는 서버다. 이 지표는 배포의 확장 및 축소에 관한 동작을 주관한다. 이제 이 metric서버를 설치를 할 것이다. helm 글로벌 chart list에서 metric 서버를 설치해보자. 다음 코드로 설치를 진행한다.
helm install stable/metrics-server \
    --name metrics-server \
    --version 2.0.4 \
    --namespace metrics
설치가 정상적으로 진행되면 다음과 같은 로그를 볼 수 있다.
NAME:   metrics-server
LAST DEPLOYED: Sat Oct 19 08:03:30 2019
NAMESPACE: metrics
STATUS: DEPLOYED

RESOURCES:
==> v1/ClusterRole
NAME                   AGE
system:metrics-server  0s

==> v1/ClusterRoleBinding
NAME                                  AGE
metrics-server:system:auth-delegator  0s
system:metrics-server                 0s

==> v1/Pod(related)
NAME                             READY  STATUS             RESTARTS  AGE
metrics-server-5b5bfd85cf-crbn5  0/1    ContainerCreating  0         0s

==> v1/Service
NAME            TYPE       CLUSTER-IP     EXTERNAL-IP  PORT(S)  AGE
metrics-server  ClusterIP  10.100.132.85  <none>       443/TCP  0s

==> v1/ServiceAccount
NAME            SECRETS  AGE
metrics-server  1        0s

==> v1beta1/APIService
NAME                    AGE
v1beta1.metrics.k8s.io  0s

==> v1beta1/RoleBinding
NAME                        AGE
metrics-server-auth-reader  0s

==> v1beta2/Deployment
NAME            READY  UP-TO-DATE  AVAILABLE  AGE
metrics-server  0/1    1           0          0s


NOTES:
The metric server has been deployed.

In a few minutes you should be able to list metrics using the following
command:

  kubectl get --raw "/apis/metrics.k8s.io/v1beta1/nodes"
api service가 제대로 실행되고 있는지 확인을 해보면,
apiVersion: apiregistration.k8s.io/v1
kind: APIService
metadata:
  creationTimestamp: "2019-10-19T08:03:30Z"
  labels:
    app: metrics-server
    chart: metrics-server-2.0.4
    heritage: Tiller
    release: metrics-server
  name: v1beta1.metrics.k8s.io
  resourceVersion: "14654"
  selfLink: /apis/apiregistration.k8s.io/v1/apiservices/v1beta1.metrics.k8s.io
  uid: f03b0180-f246-11e9-b522-0245eea98ecc
spec:
  group: metrics.k8s.io
  groupPriorityMinimum: 100
  insecureSkipTLSVerify: true
  service:
    name: metrics-server
    namespace: metrics
  version: v1beta1
  versionPriority: 100
status:
  conditions:
  - lastTransitionTime: "2019-10-19T08:03:34Z"
    message: all checks passed
    reason: Passed
    status: "True"
    type: Available

ec2-user:~/environment $ kubectl get apiservice
NAME                                   SERVICE                  AVAILABLE   AGE
v1.                                    Local                    True        6h
v1.apps                                Local                    True        6h
v1.authentication.k8s.io               Local                    True        6h
v1.authorization.k8s.io                Local                    True        6h
v1.autoscaling                         Local                    True        6h
v1.batch                               Local                    True        6h
v1.networking.k8s.io                   Local                    True        6h
v1.rbac.authorization.k8s.io           Local                    True        6h
v1.storage.k8s.io                      Local                    True        6h
v1alpha1.crd.k8s.amazonaws.com         Local                    True        6h
v1beta1.admissionregistration.k8s.io   Local                    True        6h
v1beta1.apiextensions.k8s.io           Local                    True        6h
v1beta1.apps                           Local                    True        6h
v1beta1.authentication.k8s.io          Local                    True        6h
v1beta1.authorization.k8s.io           Local                    True        6h
v1beta1.batch                          Local                    True        6h
v1beta1.certificates.k8s.io            Local                    True        6h
v1beta1.coordination.k8s.io            Local                    True        6h
v1beta1.events.k8s.io                  Local                    True        6h
v1beta1.extensions                     Local                    True        6h
v1beta1.metrics.k8s.io                 metrics/metrics-server   True        3h
v1beta1.policy                         Local                    True        6h
v1beta1.rbac.authorization.k8s.io      Local                    True        6h
v1beta1.scheduling.k8s.io              Local                    True        6h
v1beta1.storage.k8s.io                 Local                    True        6h
v1beta2.apps                           Local                    True        6h
v2beta1.autoscaling                    Local                    True        6h
v2beta2.autoscaling                    Local                    True        6h
다음과 같이 available하고, vlbetal.metrics.k8s.io가 실행되고 있는 것을 알 수 있다.
이제 Kubernetes에서 제공하는 기본 앱 샘플을 생성할 것이다. 생성하면 그에 대한 deployment와 service가 생성된다.
c2-user:~/environment $ kubectl run php-apache --image=k8s.gcr.io/hpa-example --requests=cpu=200m --expose --port=80
kubectl run --generator=deployment/apps.v1 is DEPRECATED and will be removed in a future version. Use kubectl run --generator=run-pod/v1 or kubectl create instead.
service/php-apache created
deployment.apps/php-apache created
ec2-user:~/environment $ kubectl get service
kuNAME         TYPE        CLUSTER-IP       EXTERNAL-IP   PORT(S)   AGE
kubernetes   ClusterIP   10.100.0.1       <none>        443/TCP   8h
php-apache   ClusterIP   10.100.207.222   <none>        80/TCP    42s
ec2-user:~/environment $ kubectl get deployment
NAME         READY   UP-TO-DATE   AVAILABLE   AGE
php-apache   1/1     1            1           48s
php-apache 앱에 대해서 hpa 오토 스케일링을 적용하기 위해서 다음 명령어를 입력하자. 입력 후, 오토 스케일링이 어떤 상태인지 까지 조회해보자.
ec2-user:~/environment $ kubectl autoscale deployment php-apache --cpu-percent=50 --min=1 --max=10
horizontalpodautoscaler.autoscaling/php-apache autoscaled
ec2-user:~/environment $ kubectl get hpa
NAME         REFERENCE               TARGETS   MINPODS   MAXPODS   REPLICAS   AGE
php-apache   Deployment/php-apache   0%/50%    1         10        1          38m
wget 요청을 지속적으로 앱에 보내어 부하를 가한다.
ec2-user:~/environment $ kubectl run -i --tty load-generator --image=busybox /bin/sh
kubectl run --generator=deployment/apps.v1 is DEPRECATED and will be removed in a future version. Use kubectl run --generator=run-pod/v1 or kubectl create instead.
If you don't see a command prompt, try pressing enter.
/ # while true; do wget -q -O - http://php-apache; done
OK!OK!OK!OK!OK!OK!OK!OK!OK!OK!OK!OK!OK!OK!OK!OK!OK!OK!OK!OK!OK!OK!OK!OK!OK!OK!OK!OK!OK!OK!OK!OK!OK!OK!OK!OK!OK!OK!OK!OK!OK!OK!OK!OK!OK!OK!OK!OK!OK!OK!OK!OK!OK!OK!OK!OK!OK!OK!OK!OK!OK!OK
그에 따라 지속적으로 hpa의 상태를 조회하면 다음과 같이 auto scaling이 적용이 되어 replica의 수가 늘어나는 것을 관찰 할 수 있다.
ec2-user:~/environment $ kubectl get hpa -w
NAME         REFERENCE               TARGETS   MINPODS   MAXPODS   REPLICAS   AGE
php-apache   Deployment/php-apache   0%/50%    1         10        1          76m
php-apache   Deployment/php-apache   209%/50%   1     10    1     76m
php-apache   Deployment/php-apache   209%/50%   1     10    4     76m
php-apache   Deployment/php-apache   209%/50%   1     10    5     77m
5-2. CA
먼저 다음을 입력하여 CA를 하기 위한 yml파일을 불러온다.
mkdir ~/environment/cluster-autoscaler
cd ~/environment/cluster-autoscaler
wget https://eksworkshop.com/scaling/deploy_ca.files/cluster_autoscaler.yml
다음, 노드를 생성할 때 같이 생성되었던 auto-scaling그룹의 최소 - 최대 용량을 2 - 8로 조정한다.
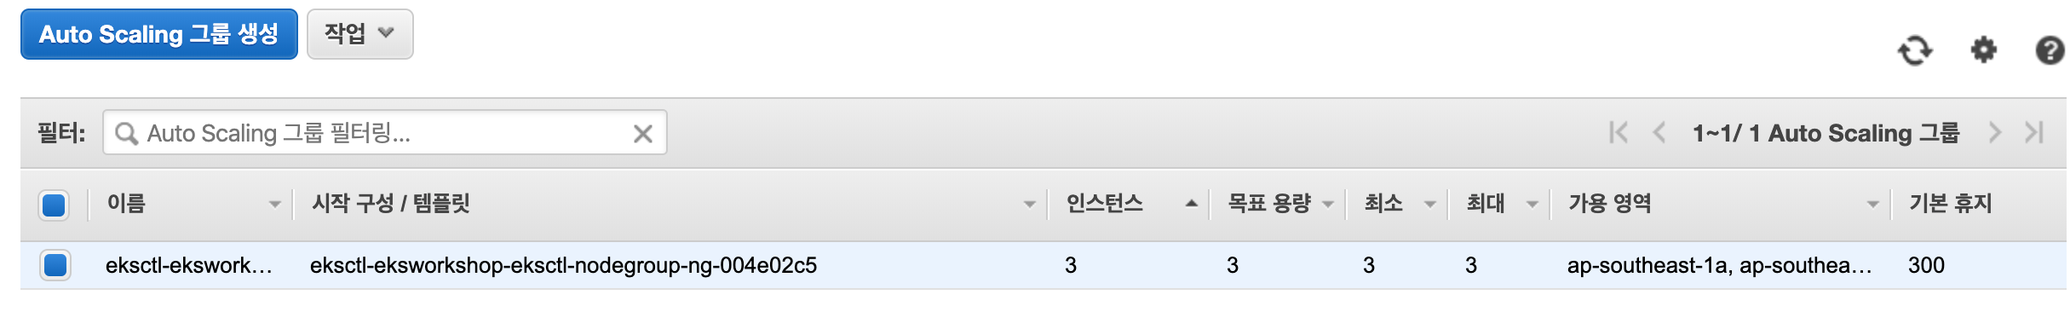

다음과 같이 구성하였으면, 이제 CA를 구성하겠다. 방금 다운받은 yml파일을 열어 132행에 있는 <AUTOSCALING GROUP NAME>을 자신의 auto-scaling group name으로 바꾼다. 필자는 이렇게 바꾸었다.
command:
            - ./cluster-autoscaler
            - --v=4
            - --stderrthreshold=info
            - --cloud-provider=aws
            - --skip-nodes-with-local-storage=false
            - --nodes=2:8:eksctl-eksworkshop-eksctl-nodegroup-ng-004e02c5-NodeGroup-1L9BVBKLDPZWY
          env:
            - name: AWS_REGION
              value: ap-southeast
다음, auto-scaling을 다룰 수 있는 권한을 다음 코드를 통해 추가한다.
mkdir ~/environment/asg_policy
cat <<EoF > ~/environment/asg_policy/k8s-asg-policy.json
{
  "Version": "2012-10-17",
  "Statement": [
    {
      "Effect": "Allow",
      "Action": [
        "autoscaling:DescribeAutoScalingGroups",
        "autoscaling:DescribeAutoScalingInstances",
        "autoscaling:SetDesiredCapacity",
        "autoscaling:TerminateInstanceInAutoScalingGroup",
        "autoscaling:DescribeTags"
      ],
      "Resource": "*"
    }
  ]
}
EoF
aws iam put-role-policy --role-name $ROLE_NAME --policy-name ASG-Policy-For-Worker --policy-document file://~/environment/asg_policy/k8s-asg-policy.json
get-role하였을 때 다음과 같이 출력되면 정상적으로 적용이 된 것이다.

최종적으로 auto-scaler의 yml를 apply하게 되면, 다음과 같은 자원들이 생성된다.
kubectl apply -f ~/environment/cluster-autoscaler/cluster_autoscaler.yml
kubectl logs -f deployment/cluster-autoscaler -n kube-system

CA가 제대로 작동하는지 확인 하기 위해 샘플 앱의 deployment를 생성한다.
cat <<EoF> ~/environment/cluster-autoscaler/nginx.yaml
apiVersion: extensions/v1beta1
kind: Deployment
metadata:
  name: nginx-to-scaleout
spec:
  replicas: 1
  template:
    metadata:
      labels:
        service: nginx
        app: nginx
    spec:
      containers:
      - image: nginx
        name: nginx-to-scaleout
        resources:
          limits:
            cpu: 500m
            memory: 512Mi
          requests:
            cpu: 500m
            memory: 512Mi
EoF
kubectl apply -f ~/environment/cluster-autoscaler/nginx.yaml
kubectl get deployment/nginx-to-scaleout
다음과 같이 deployment의 scale을 증가시킨 다음, 실제로 콘솔을 확인하면 node가 추가된 것을 알 수 있다. (저는 실패해서 원인 분석중입니다.)

6. Prometheus
SoundCloud에서 제작한 시스템 모니터링 및 알람 툴킷이다. 현재는 독립형 오픈소스 프로젝트가 되었으며, 모든 사용자가 독립적으로 유지보수한다. 이 프로젝트는 2016년 두 번째 호스팅 프로젝트로 Cloud Native Computing Foundation에 합류하였다.
프로메테우스의 기능을 정리해보았다.
-
metric 이름과 키-값으로 구분되는 다양한 시계열를 가진 다차원 데이터 모델을 지원한다.
-
다차원 데이터를 처리하기 위해 PromQL이라는 질의어를 사용한다.
-
분산 스토리지에 의존하지 않으며, 단일 서버 노드는 자율적이다.
-
HTTP의 pull model을 통해 시계열 수집이 일어난다.
-
중개 게이트워이를 통해 시계열의 push를 지원한다.
-
다양한 형태의 그래프 및 대시보드를 지원한다.
프로메테우스의 구조는 다음과 같다.

프로메테우스 설치
먼저 다음 명령어로 prometheus라는 이름을 가진 namespace를 만들고, helm을 통해서 prometheus를 설치한다.
kubectl create namespace prometheus
helm install stable/prometheus
--name prometheus --namespace prometheus
--set alertmanager.persistentVolume.storageClass="gp2"
--set server.persistentVolume.storageClass="gp2"
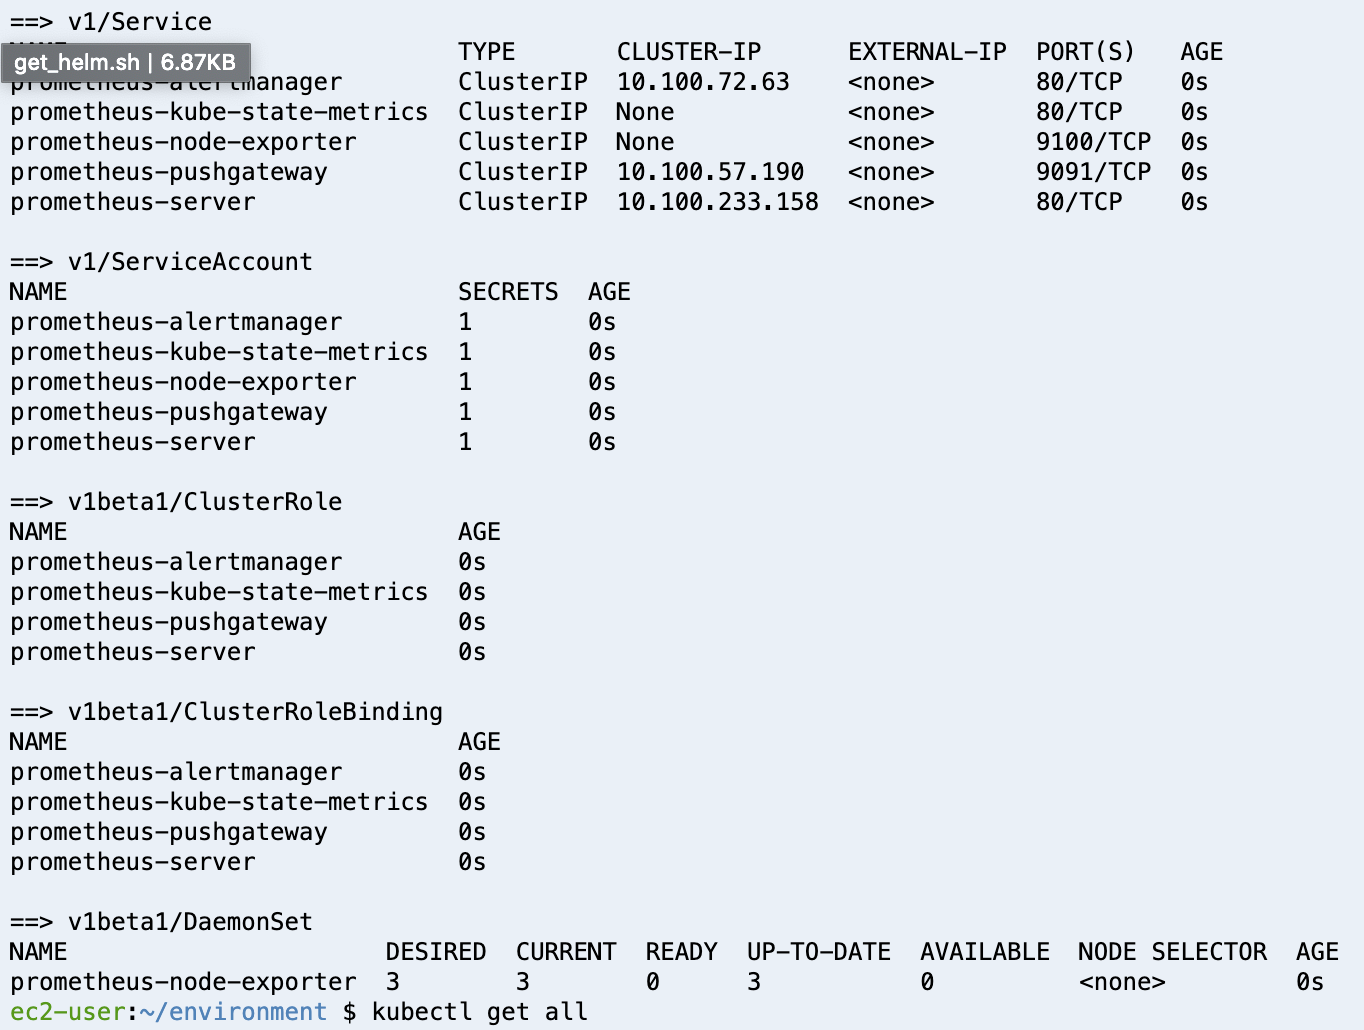
설치가 완료되면, prometheus를 설치하며 생긴 리소스가 다음과 같이 출력된다.

서비스에 연결하기 위해 8080포트를 9090으로 포워딩시킨 후, /targets를 c9의 주소 뒤에 붙여서 앱의 preview를 확인한다. 정상적으로 이루어 졌다면 다음과 같은 화면을 볼 수 있다.

7. Grafana
grafana를 설치해보자. 다음 명령어로 helm으로 grafana를 불러오자.
kubectl create namespace grafana
helm install stable/grafana \
    --name grafana \
    --namespace grafana \
    --set persistence.storageClassName="gp2" \
    --set adminPassword="EKS!sAWSome" \
    --set datasources."datasources\.yaml".apiVersion=1 \
    --set datasources."datasources\.yaml".datasources[0].name=Prometheus \
    --set datasources."datasources\.yaml".datasources[0].type=prometheus \
    --set datasources."datasources\.yaml".datasources[0].url=http://prometheus-server.prometheus.svc.cluster.local \
    --set datasources."datasources\.yaml".datasources[0].access=proxy \
    --set datasources."datasources\.yaml".datasources[0].isDefault=true \
    --set service.type=LoadBalancer

설치 후, 다음과 같이 리소스들이 출력되면 정상이다.
kubectl get all -n grafana로 외부에 공개된 로드밸런서 주소를 확인 한다. 그리고, admin의 암호를 발급받는다.
해당 로드 밸런서 주소로 들어가면 로그인 화면이 노출된다.


접속이 되면, 다음과 같은 grafana 대시보드가 뜬다.

+를 눌러서 나오는 드롭박스의 import를 눌러서 3146을 다음과 같이 입력한다.

잠시 기다리면 다음과 같은 화면이 노출되며, Prometheus탭의 값을 Prometheus로 설정하고 Import를 클릭한다.
클릭하면 다음과 같은 화면이 노출된다.

'IT > Cloud' 카테고리의 다른 글
| [AWS-CLI] aws: command not found 해결법 (0) | 2019.11.14 |
|---|---|
| [AWS] AWS 공식 홈페이지의 Default Limit과 Service Quota의 Default Limit가 다른 이유 (0) | 2019.11.13 |
| [AWS & Kubernetes] Kubernetes와 EKS (0) | 2019.11.10 |
| 가상화와 하이퍼바이저 (0) | 2019.11.10 |
| [AWS] Private instance와 Load Balancer연결 시 timeout이 발생하는 이슈 (0) | 2019.11.10 |